Companion page for the paper submitted to the 2024 58th Asilomar Conference on Signals, Systems, and Computers, Pacific Grove, CA, USA.
This page contains information of the dataset used and the data pre-processing.
Abstract
Automatic tuning of reverberation algorithms relies on the optimization of a cost function.
While general audio similarity metrics are useful, they are not optimized for the specific statistical properties of reverberation in rooms.
This paper presents two novel metrics for assessing the similarity of late reverberation in room impulse responses.
These metrics are differentiable and can be utilized within a machine-learning framework.
We compare the performance of these metrics to two popular audio metrics using a large dataset of room impulse responses encompassing various room configurations and microphone positions.
The results indicate that the proposed functions based on averaged power and frequency-band energy decay outperform the baselines with the former exhibiting the most suitable profile towards the minimum.
The proposed work holds promise as an improvement to the design and evaluation of reverberation similarity metrics.
Dataset of RIRs from variable acoustics room Arni
The RIR used in the objective evaluation can be downloaded from Zotero. Reference paper: Calibrating the Sabine and Eyring formulas, K. Prawda et al.
The Arni room is a variable acoustics laboratory at Acoustics Lab of Aalto University, Espoo, Finland.
It's a rectangular room with dimensions 8.9 m x 6.3 x 3.6 m (length, width, and height, respectively).
The walls and ceiling of Arni are covered with 55 variable acoustics panels made from painted metal sheets and filled with absorptive material.
The dataset contains RIRs from 5342 panel configurations and 5 microphone positions.
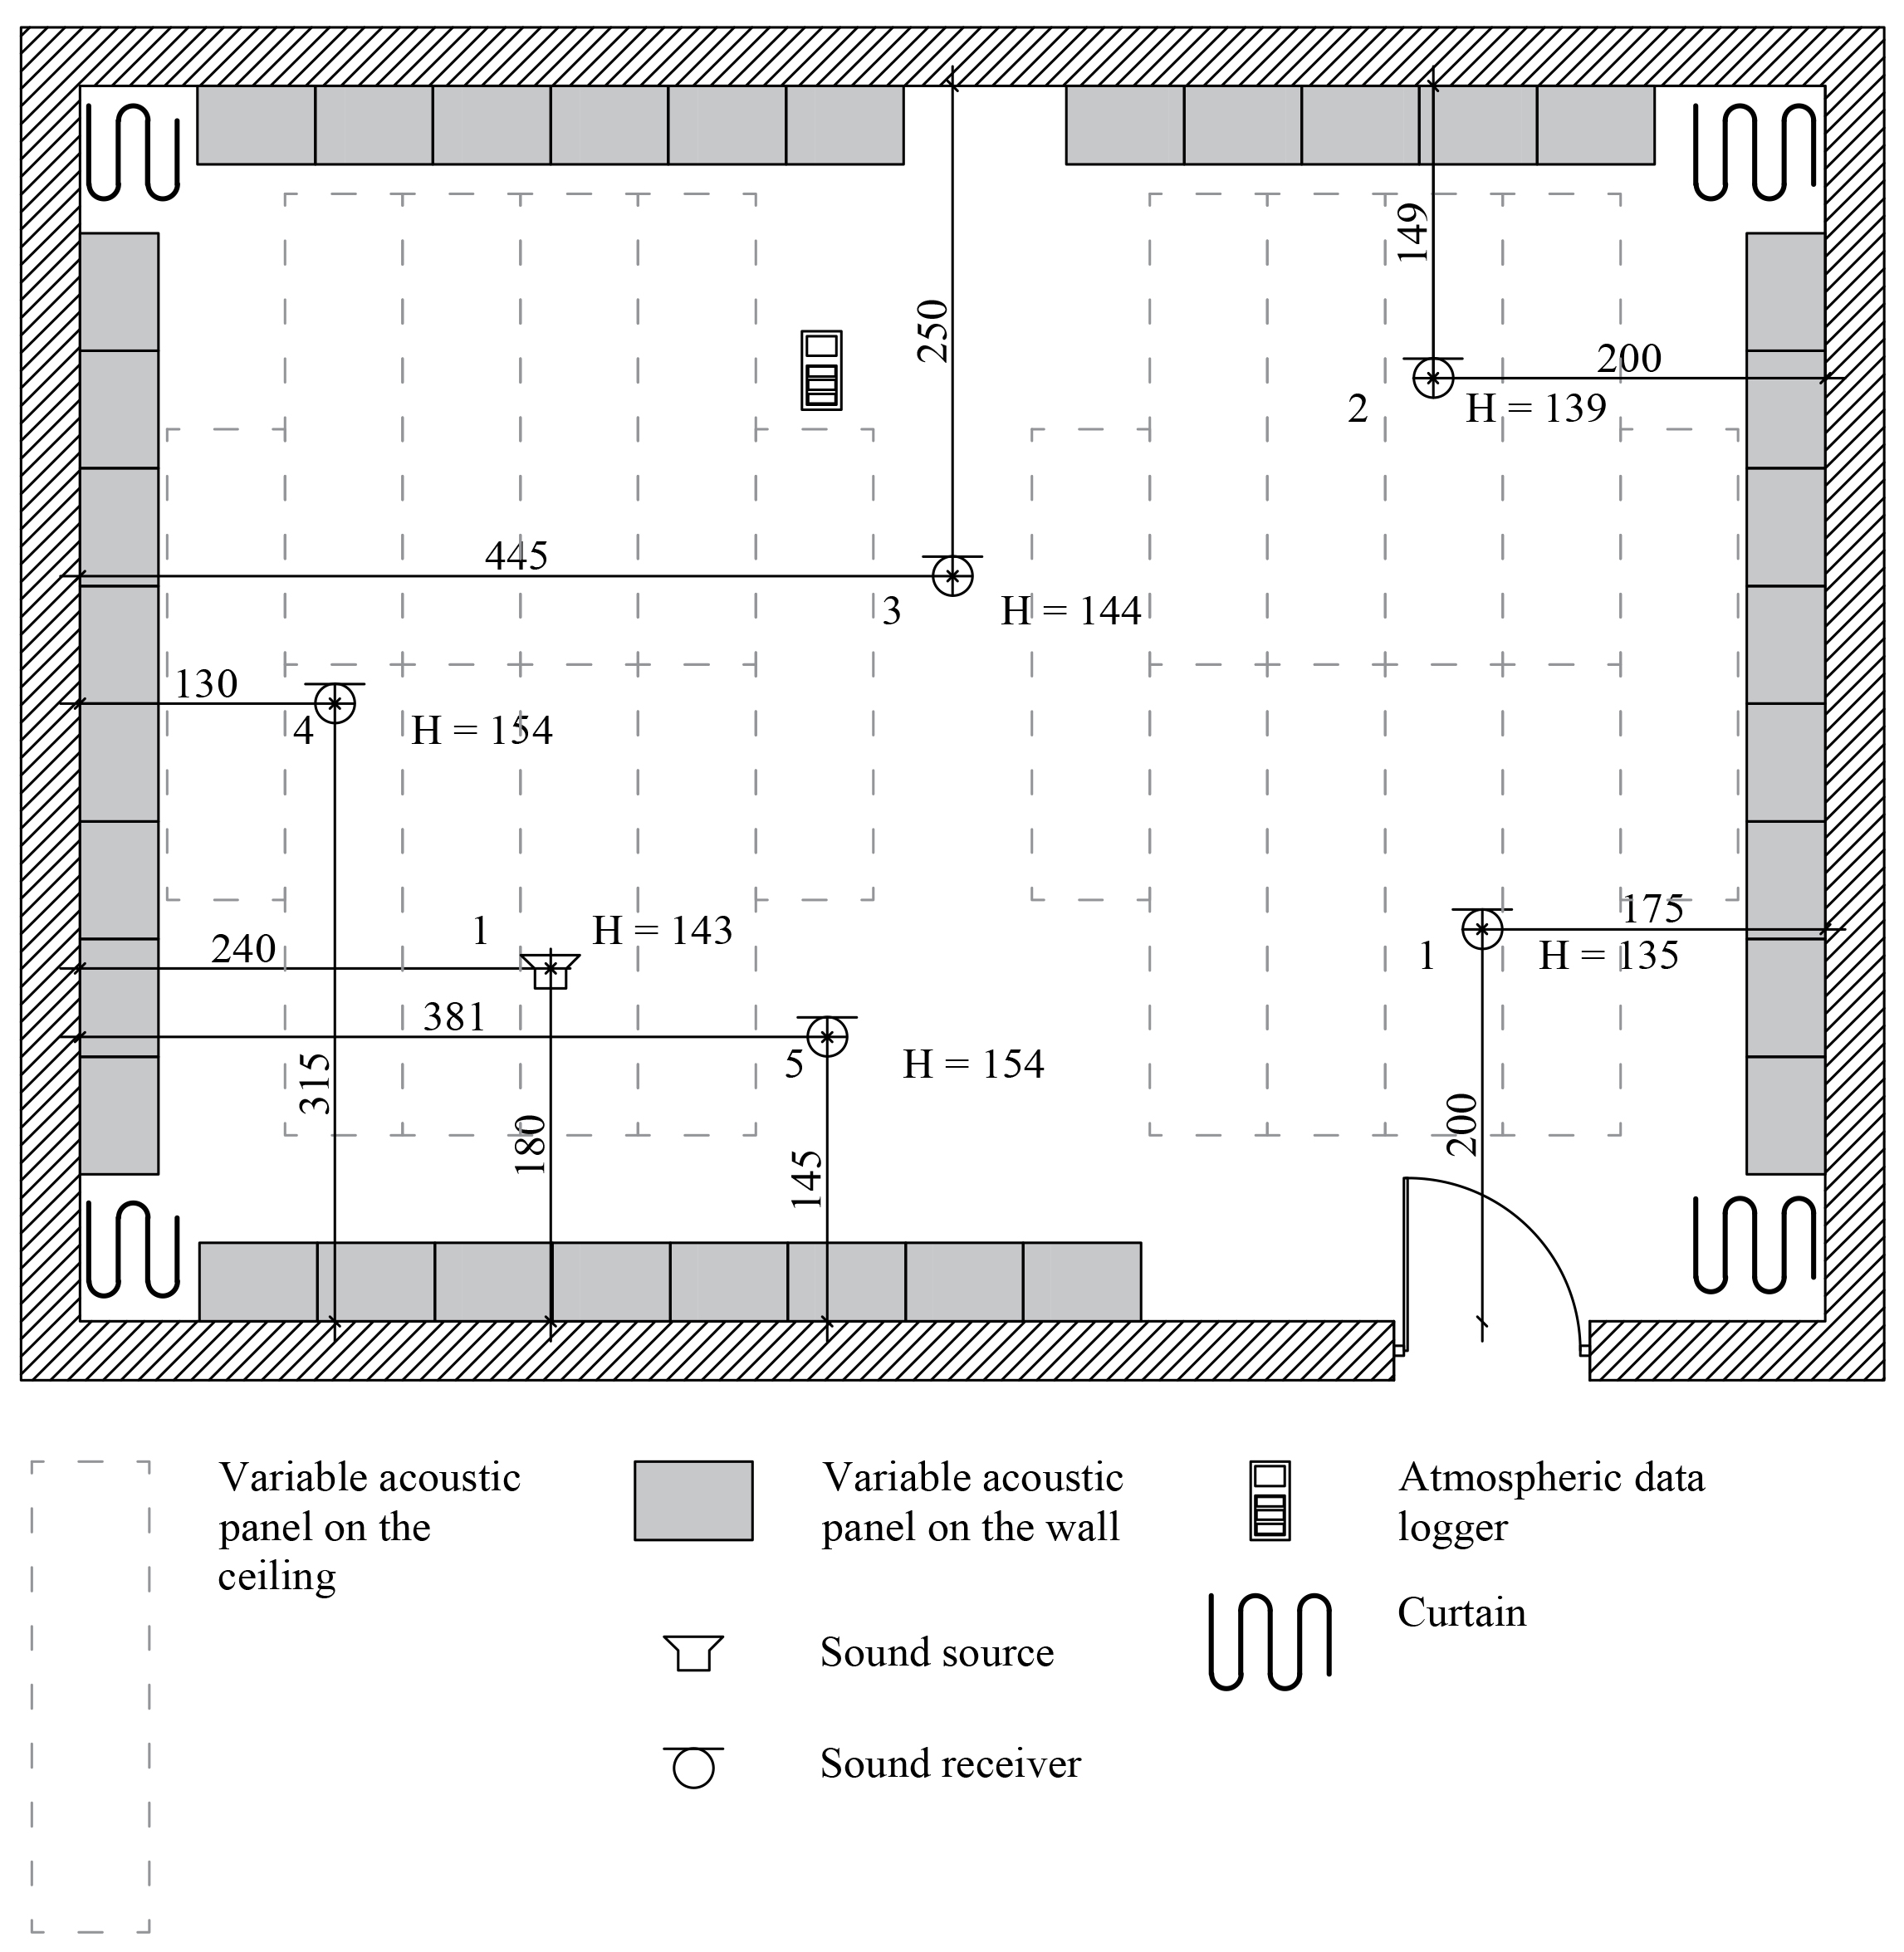
Layout of the variable acoustics room Arni showing the positions of the panels, sound source, and receivers.
Data pre-processing
Since our focus lies solely on the late reverberation, we remove the direct and early reflections from all RIRs.
To detect the onset, we analyze the energy variation over time using the STFT to identify the frame with the most significant energy change. The onset time is then determined from the index of the STFT window after conversion to the time domain.
The mixing time refers to the point in time beyond which the auditory system cannot differentiate between successive reflections, delineating the transition between early reflections and late reverberation.
To understand the distribution of the mixing time across Arni room configurations, we compute it for all RIRs in the dataset. Among various definitions of mixing time, we adopt the definition provided in A Simple, Robust Measure of Reverberation Echo Density where it is defined as the time instant at which the RIR exhibits Gaussian distribution, utilizing a threshold value of 0.9.
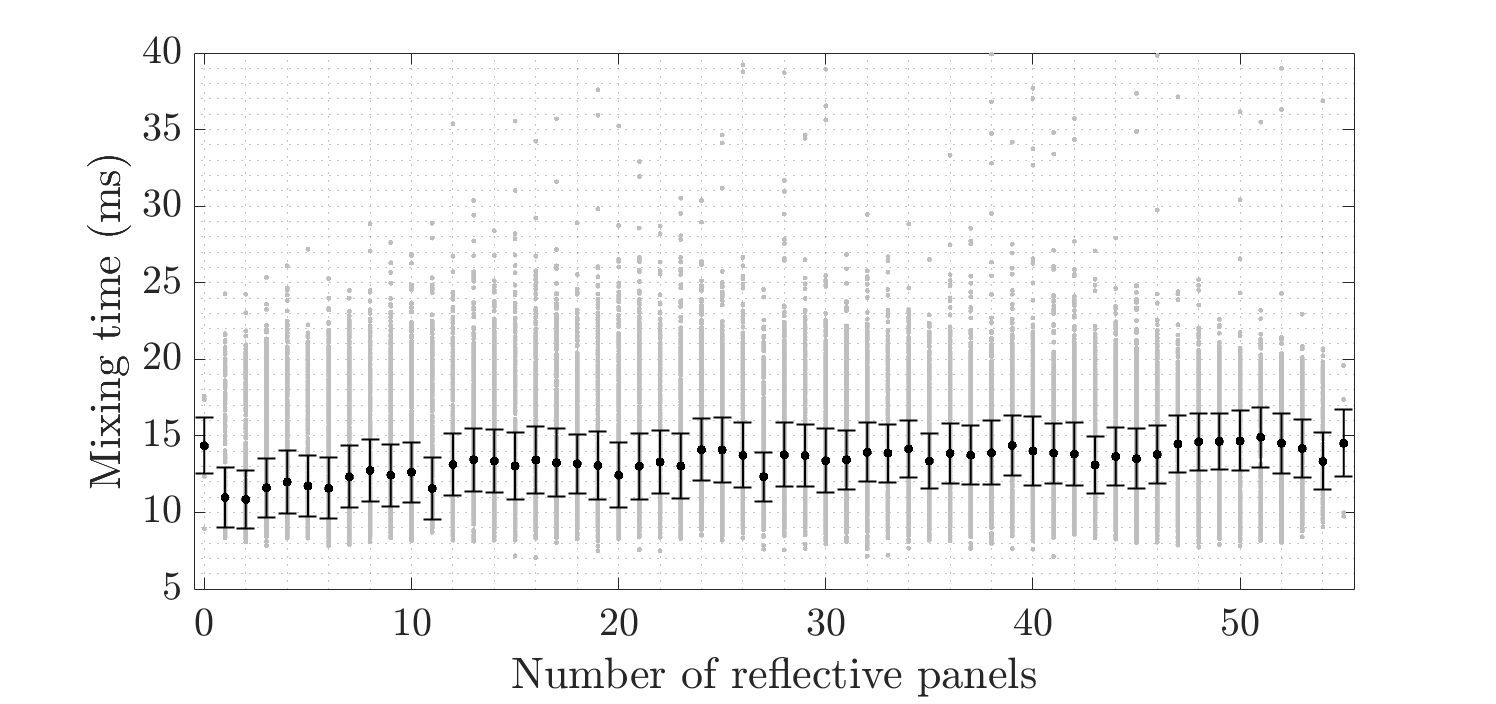
Mixing time of Arni RIRs. From the original dataset, only one out of 5 RIR per configuration is used, leading to a total of 26710 RIRs. Black markers indicate the variants and the standard deviation is indicated by the error bar.
The figure above, illustrates the mixing time values for the RIRs measured in Arni room. These values are grouped according to the number of reflective panels, with median and standard deviation depicted in black.
Across groups, the values typically range between 10 and 20 ms. Usually, the prolonged presence of sound in a highly reverberant space helps in more rapid distribution of sound energy throughout the room, thus reducing the mixing time.
However, a slight decrease in the median for lower reverberant conditions can be noted. This can be attributed to sound diffraction at the edges of the panel openings when configured as absorptive.
Note that for a number of closed panels of 0 and 55 the values only one RIR is measured for each microphone positions.