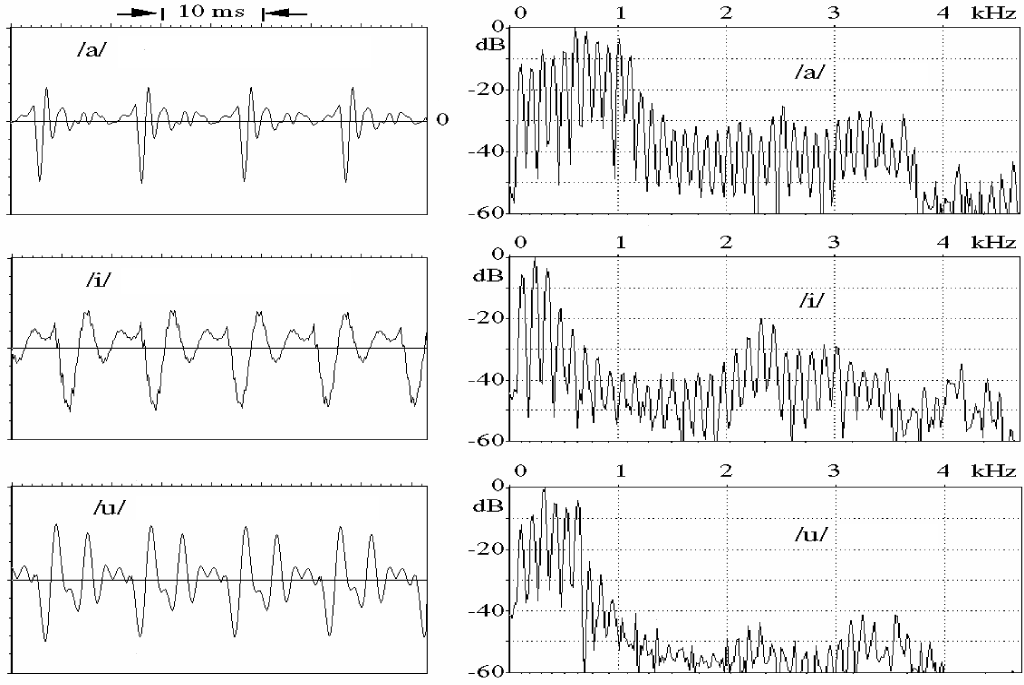
Fig. 3.1. The time- and frequency-domain presentation of vowels /a/, /i/, and /u/.
3. Phonetics and Theory of Speech Production
Speech processing and language technology contains lots of special concepts and terminology. To understand how different speech synthesis and analysis methods work we must have some knowledge of speech production, articulatory phonetics, and some other related terminology. The basic theory of these topics will be discussed briefly in this chapter. For more detailed information, see for example Fant (1970), Flanagan (1972), Witten (1982), O'Saughnessy (1987), or Kleijn et al (1998).
3.1 Representation and Analysis of Speech Signals
Continuous speech is a set of complicated audio signals which makes producing them artificially difficult. Speech signals are usually considered as voiced or unvoiced, but in some cases they are something between these two. Voiced sounds consist of fundamental frequency (F0) and its harmonic components produced by vocal cords (vocal folds). The vocal tract modifies this excitation signal causing formant (pole) and sometimes antiformant (zero) frequencies (Witten 1982). Each formant frequency has also an amplitude and bandwidth and it may be sometimes difficult to define some of these parameters correctly. The fundamental frequency and formant frequencies are probably the most important concepts in speech synthesis and also in speech processing in general.
With purely unvoiced sounds, there is no fundamental frequency in excitation signal and therefore no harmonic structure either and the excitation can be considered as white noise. The airflow is forced through a vocal tract constriction which can occur in several places between glottis and mouth. Some sounds are produced with complete stoppage of airflow followed by a sudden release, producing an impulsive turbulent excitation often followed by a more protracted turbulent excitation (Kleijn et al. 1998). Unvoiced sounds are also usually more silent and less steady than voiced ones. The differences between these are easy to see from Figure 3.2 where the second and last sounds are voiced and the others unvoiced. Whispering is the special case of speech. When whispering a voiced sound there is no fundamental frequency in the excitation and the first formant frequencies produced by vocal tract are perceived.
Speech signals of the three vowels (/a/ /i/ /u/) are presented in time- and frequency domain in Figure 3.1. The fundamental frequency is about 100 Hz in all cases and the formant frequencies F1, F2, and F3 with vowel /a/ are approximately 600 Hz, 1000 Hz, and 2500 Hz respectively. With vowel /i/ the first three formants are 200 Hz, 2300 Hz, and 3000 Hz, and with /u/ 300 Hz, 600 Hz, and 2300 Hz. The harmonic structure of the excitation is also easy to perceive from frequency domain presentation.

Fig. 3.1. The time- and frequency-domain presentation of vowels /a/, /i/, and /u/.
It can be seen that the first three formants are inside the normal telephone channel (from 300 Hz to 3400 Hz) so the needed bandwidth for intelligible speech is not very wide. For higher quality, up to 10 kHz bandwidth may be used which leads to 20 kHz sampling frequency. Unless, the fundamental frequency is outside the telephone channel, the human hearing system is capable to reconstruct it from its harmonic components.
Another commonly used method to describe a speech signal is the spectrogram which is a time-frequency-amplitude presentation of a signal. The spectrogram and the time-domain waveform of Finnish word kaksi (two) are presented in Figure 3.2. Higher amplitudes are presented with darker gray-levels so the formant frequencies and trajectories are easy to perceive. Also spectral differences between vowels and consonants are easy to comprehend. Therefore, spectrogram is perhaps the most useful presentation for speech research. From Figure 3.2 it is easy to see that vowels have more energy and it is focused at lower frequencies. Unvoiced consonants have considerably less energy and it is usually focused at higher frequencies. With voiced consonants the situation is something between of these two. In Figure 3.2 the frequency axis is in kilohertz, but it is also quite common to use an auditory spectrogram where the frequency axis is replaced with Bark- or Mel-scale which is normalized for hearing properties.
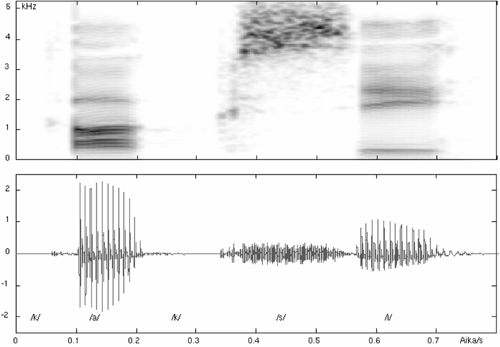
Fig. 3.2. Spectrogram and time-domain presentation of Finnish word kaksi (two).
For determining the fundamental frequency or pitch of speech, for example a method called cepstral analysis may be used (Cawley 1996, Kleijn et al. 1998). Cepstrum is obtained by first windowing and making Discrete Fourier Transform (DFT) for the signal and then logaritmizing power spectrum and finally transforming it back to the time-domain by Inverse Discrete Fourier Transform (IDFT). The procedure is shown in Figure 3.3.

Fig. 3.3. Cepstral analysis.
Cepstral analysis provides a method for separating the vocal tract information from excitation. Thus the reverse transformation can be carried out to provide smoother power spectrum known as homomorphic filtering.
Fundamental frequency or intonation contour over the sentence is important for correct prosody and natural sounding speech. The different contours are usually analyzed from natural speech in specific situations and with specific speaker characteristics and then applied to rules to generate the synthetic speech. The fundamental frequency contour can be viewed as the composite set of hierarchical patterns shown in Figure 3.4. The overall contour is generated by the superposition of these patterns (Sagisaga 1990). Methods for controlling the fundamental frequency contours are described later in Chapter 5.
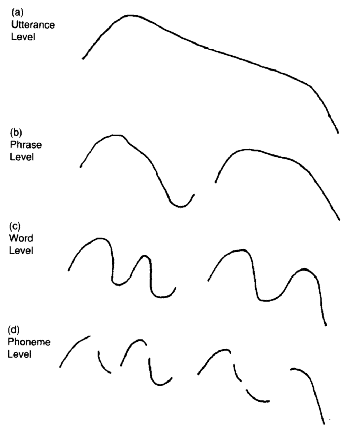
Fig. 3.4. Hierarchical levels of fundamental frequency (Sagisaga 1990).
Human speech is produced by vocal organs presented in Figure 3.5. The main energy source is the lungs with the diaphragm. When speaking, the air flow is forced through the glottis between the vocal cords and the larynx to the three main cavities of the vocal tract, the pharynx and the oral and nasal cavities. From the oral and nasal cavities the air flow exits through the nose and mouth, respectively. The V-shaped opening between the vocal cords, called the glottis, is the most important sound source in the vocal system. The vocal cords may act in several different ways during speech. The most important function is to modulate the air flow by rapidly opening and closing, causing buzzing sound from which vowels and voiced consonants are produced. The fundamental frequency of vibration depends on the mass and tension and is about 110 Hz, 200 Hz, and 300 Hz with men, women, and children, respectively. With stop consonants the vocal cords may act suddenly from a completely closed position in which they cut the air flow completely, to totally open position producing a light cough or a glottal stop. On the other hand, with unvoiced consonants, such as /s/ or /f/, they may be completely open. An intermediate position may also occur with for example phonemes like /h/.
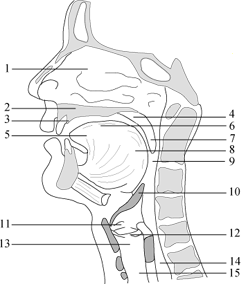
Fig. 3.5. The human vocal organs. (1) Nasal cavity, (2) Hard palate, (3) Alveoral ridge, (4) Soft palate (Velum), (5) Tip of the tongue (Apex), (6) Dorsum, (7) Uvula, (8) Radix, (9) Pharynx, (10) Epiglottis, (11) False vocal cords, (12) Vocal cords, (13) Larynx, (14) Esophagus, and (15) Trachea.
The pharynx connects the larynx to the oral cavity. It has almost fixed dimensions, but its length may be changed slightly by raising or lowering the larynx at one end and the soft palate at the other end. The soft palate also isolates or connects the route from the nasal cavity to the pharynx. At the bottom of the pharynx are the epiglottis and false vocal cords to prevent food reaching the larynx and to isolate the esophagus acoustically from the vocal tract. The epiglottis, the false vocal cords and the vocal cords are closed during swallowing and open during normal breathing.
The oral cavity is one of the most important parts of the vocal tract. Its size, shape and acoustics can be varied by the movements of the palate, the tongue, the lips, the cheeks and the teeth. Especially the tongue is very flexible, the tip and the edges can be moved independently and the entire tongue can move forward, backward, up and down. The lips control the size and shape of the mouth opening through which speech sound is radiated. Unlike the oral cavity, the nasal cavity has fixed dimensions and shape. Its length is about 12 cm and volume 60 cm3. The air stream to the nasal cavity is controlled by the soft palate.
From technical point of view, the vocal system may be considered as a single acoustic tube between the glottis and mouth. Glottal excited vocal tract may be then approximated as a straight pipe closed at the vocal cords where the acoustical impedance Zg= ¥ and open at the mouth (Zm = 0). In this case the volume-velocity transfer function of vocal tract is (Flanagan 1972, O'Saughnessy 1987)
 ,
,
where l is the length of the tube, w is radian frequency and c is sound velocity. The denominator is zero at frequencies Fi = w i/2p (i=1,2,3,...), where
![]() ,
,
If l=17 cm, V(w ) is infinite at frequencies Fi = 500, 1500, 2500,... Hz which means resonances every 1 kHz starting at 500 Hz. If the length l is other than 17 cm, the frequencies Fi will be scaled by factor 17/l so the vocal tract may be approximated with two or three sections of tube where the areas of adjacent sections are quite different and resonances can be associated within individual cavities. Vowels can be approximated with a two-tube model presented on the left in Figure 3.6. For example, with vowel /a/ the narrower tube represents the pharynx opening into wider tube representing the oral cavity. If assumed that both tubes have an equal length of 8.5 cm, formants occur at twice the frequencies noted earlier for a single tube. Due to acoustic coupling, formants do not approach each other by less than 200 Hz so formants F1 and F2 for /a/ are not both at 1000 Hz, but rather 900 Hz and 1100 Hz, respectively (O'Saughnessy 1987).
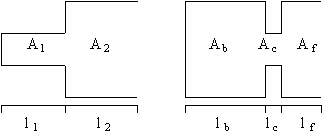
Fig. 3.6. Examples of two- and three-tube models for the vocal tract.
Consonants can be approximated similarly with a three-tube model shown on the right in Figure 3.5., where the narrow middle tube models the vocal tract constriction. The back and middle tubes are half-wavelength resonators and the front tube is a quarter-wavelength resonator with resonances
![]() ,
,
where lb, lc, and lf are the length of the back, center, and front tube, respectively. With the typical constriction length of 3 cm the resonances occur at multiples of 5333 Hz and can be ignored in applications that use less than 5 kHz bandwidth (O'Saughnessy 1987).
The excitation signal may be modeled with a two-mass model of the vocal cords which consists of two masses coupled with a spring and connected to the larynx by strings and dampers (Fant 1970, Veldhuis et al. 1995).
Several other methods and systems have been developed to model the human speech production system to produce synthetic speech. These methods are related with articulatory synthesis described in Chapter 5. The speech production system, models, and theory are described more closely in Fant (1970), Flanagan (1972), Witten (1982), and O'Saughnessy (1987).
In most languages the written text does not correspond to its pronunciation so that in order to describe correct pronunciation some kind of symbolic presentation is needed. Every language has a different phonetic alphabet and a different set of possible phonemes and their combinations. The number of phonetic symbols is between 20 and 60 in each language (O'Saughnessy 1987). A set of phonemes can be defined as the minimum number of symbols needed to describe every possible word in a language. In English there are about 40 phonemes (Breen et al. 1996, Donovan 1996). Due to complexity and different kind of definitions, the number of phonemes in English and most of the other languages can not be defined exactly.
Phonemes are abstract units and their pronunciation depends on contextual effects, speaker's characteristics, and emotions. During continuous speech, the articulatory movements depend on the preceding and the following phonemes. The articulators are in different position depending on the preceding one and they are preparing to the following phoneme in advance. This causes some variations on how the individual phoneme is pronounced. These variations are called allophones which are the subset of phonemes and the effect is known as coarticulation. For example, a word lice contains a light /l/ and small contains a dark /l/. These l's are the same phoneme but different allophones and have different vocal tract configurations. Another reason why the phonetic representation is not perfect, is that the speech signal is always continuous and phonetic notation is always discrete (Witten 1982). Different emotions and speaker characteristics are also impossible to describe with phonemes so the unit called phone is usually defined as an acoustic realization of a phoneme (Donovan 1996).
The phonetic alphabet is usually divided in two main categories, vowels and consonants. Vowels are always voiced sounds and they are produced with the vocal cords in vibration, while consonants may be either voiced or unvoiced. Vowels have considerably higher amplitude than consonants and they are also more stable and easier to analyze and describe acoustically. Because consonants involve very rapid changes they are more difficult to synthesize properly. The articulatory phonetics in English and Finnish are described more closely in the end of this chapter.
Some efforts to construct language-independent phonemic alphabets were made during last decades. One of the best known is perhaps IPA (International Phonetic Alphabeth) which consists of a huge set of symbols for phonemes, suprasegmentals, tones/word accent contours, and diacritics. For example, there are over twenty symbols for only fricative consonants (IPA 1998). Complexity and the use of Greek symbols makes IPA alphabet quite unsuitable for computers which usually requires standard ASCII as input. Another such kind of phonetic set is SAMPA (Speech Assessment Methods - Phonetic Alphabet) which is designed to map IPA symbols to 7-bit printable ASCII characters. In SAMPA system, the alphabets for each language are designed individually. Originally it covered European Communities languages, but the objective is to make it possible to produce a machine-readable phonetic transcription for every known human language. Alphabet known as Worldbet is another ASCII presentation for IPA symbols which is very similar to SAMPA (Altosaar et al. 1996). American linguists have developed the Arpabet phoneme alphabet to represent American English phonemes using normal ASCII characters. For example a phonetic representation in DECtalk system is based on IPA and Arpabet with some modifications and additional characters (Hallahan 1996). Few examples of different phonetic notations are given in Table 3.1.
Table 3.1. Examples of different phonetic notations.

Several other phonetic representations and alphabets are used in present systems. For example MITalk uses a set of almost 60 two-character symbols for describing phonetic segments in it (Allen et al. 1987) and it is quite common that synthesis systems use the alphabet of their own. There is still no single generally accepted phonetic alphabet.
3.3.1 English Articulatory Phonetics
Unlike in Finnish articulatory phonetics, discussed in the next chapter, the number of phonetic symbols used in English varies by different kind of definitions. Usually there are about ten to fifteen vowels and about twenty to twenty-five consonants.
English vowels may be classified by the manner or place of articulation (front-back) and by the shape of the mouth (open - close). Main vowels in English and their classification are described in Figure 3.7 below. Sometimes also some diphthongs like /ou/ in tone or /ei/ in take are described separately. Other versions of definitions of English vowels may be found for example in Rossing (1990) and O'Saughnessy (1987).
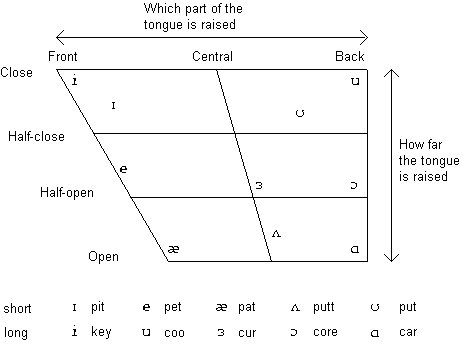
Fig. 3.7. The classification of the main vowels in English (Cawley 1996).
English consonants may be classified by the manner of articulation as plosives, fricatives, nasals, liquids, and semivowels (Cawley 1990, O'Saughnessy 1987). Plosives are known also as stop consonants. Liquids and semivowels are also defined in some publications as approximants and laterals. Further classification may be made by the place of articulation as labials (lips), dentals (teeth), alveolars (gums), palatals (palate), velars (soft palate), glottal (glottis), and labiodentals (lips and teeth). Classification of English consonants is summarized in Figure 3.8.
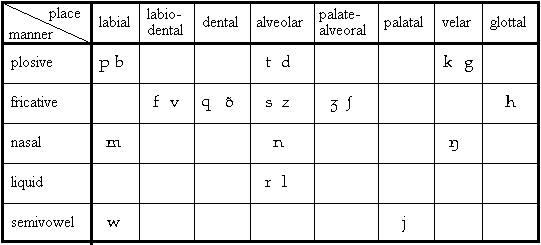
Fig. 3.8. Classification of English consonants (Cawley 1996).
Finally, consonants may be classified as voiced and unvoiced. Voiced consonants are:
![]()
others are unvoiced.
3.2.2 Finnish Articulatory Phonetics
There are eight vowels in Finnish. These vowels can be divided into different categories depending how they are formulated: Front/back position of tongue, wideness/roundness of the constriction position, place of the tongue (high or low), and how open or close the mouth is during articulation. Finnish vowels and their categorization are summarized in Figure 3.9.
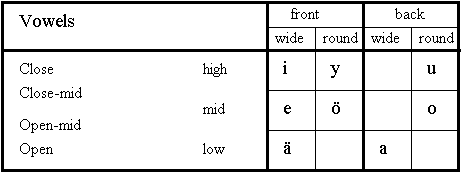
Fig. 3.9. Classification of Finnish vowels.
Finnish consonants can be divided into the following categories depending on the place and the manner of articulation:
The consonant categories are summarized in Figure 3.10. For example, for phoneme /p/, the categorization will be unvoiced bilabial-plosive.
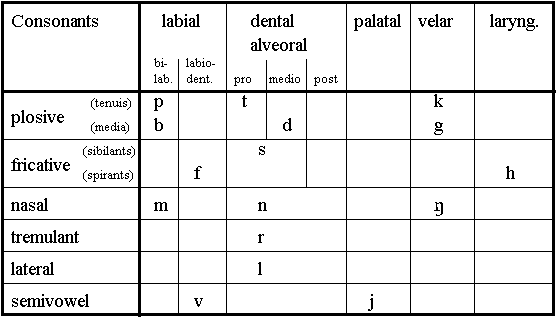
Fig. 3.10. Classification of Finnish consonants.
When synthesizing consonants, better results may be achieved by synthesizing these six consonant groups with separate methods because of different acoustic characteristics. Especially the tremulant /r/ needs a special attention.